


Working as a Product Analyst requires thinking in terms of causality. As part of Delivery Hero’s search squad, we often have to analyze how the changes in the search algorithms will affect our main metrics – Cause and effect.
This approach is very powerful, and it is the basis of the many AB tests run at Delivery Hero, which allows us to keep on trying new features in order to improve the app. However, sometimes simple causal AB tests are limiting, and it can be useful to think a little bit differently. This is when social network analysis (SNA) can come in handy.
Even though the name sounds quite modern, this kind of analysis has been used for decades, starting with the field of sociology. In this context, humans are the main actors in a particular social network, and we define the relationships (the so called edges) between them. Here, the modern take on what a social network is helps us to understand how we can define these relationships. For example, let’s think about Twitter. If I follow Barack Obama, there is some sort of connection between us (I follow him, even though he does not follow me). In SNA terms, this is an edge. Both Barack Obama and myself would be considered as nodes.
It is least common, but not completely rare, to think about network structures between non living things. Perhaps one of the most common examples is Basket market analysis, a way to know which products are being purchased together in the same transaction. My approach is closely related to this kind of analysis, but limited to what matters the most in my squad: the search terms our customers use to find their products.
Thinking of Search Terms as Nodes
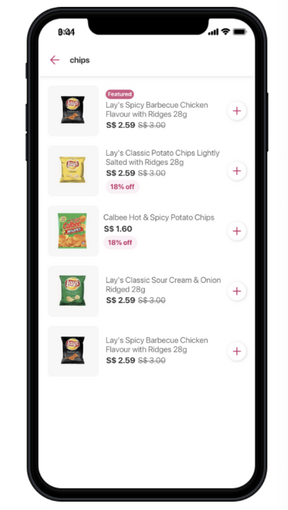
We consider the search terms (what people type in the app’s search engine), one of the most important concepts for the team, as nodes. For this example, we’ll focus on when the user searches for groceries. The logic to define edges between the nodes is quite simple: our tracking allows us to know if a product, like “chips”, was added to the cart from the search results inside the app, and ultimately, purchased.
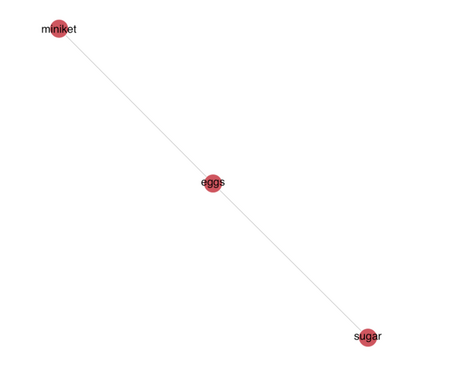
For example, the graph below represents two transactions: one where two products were added to the cart (and then purchased) using the search terms miniket and eggs (so there is one edge between the two nodes),and a second transaction where the items purchased were searched using the words eggs and sugar (so there is an edge between the two as well). Note that I am keeping my network undirected (this means I don’t care about the order in which the user added the products to the cart) for simplicity.
Applying SNA concepts
Here is the part where the fact that we are analyzing inanimate concepts and not actual entities becomes evident: it is tricky to interpret and use some of the most basic SNA concepts as actionable insights in this scenario.
For example, the graph density (the number of edges divided by the number of possible edges), a measure of how well connected the graph is, basically tells us how information flows between one graph and another. This concept could be useful in social situations: if we wanted to spread information on social media and had to prioritize the channels, we would go for large and dense networks. However the density is not necessarily something insightful when thinking of networks of search terms.
On the other hand we have centrality measurements like the betweenness, which tries to measure which are the nodes that connect other nodes the most (in the context of a pandemic, actors with high betweenness would be highly relevant, as they would be the biggest spreaders). Hmm. It is difficult to think how knowing that milk has a high betweenness could be actionable for the team. However something curious I noticed when looking at the eigenvector centrality, another type of centrality which considers the influence of a node on the whole network (as opposed to the betweenness), was that some search terms with high performance (leading to many transactions), had a high eigenvector centrality, and vice versa. In other words, some of the most searched terms were not necessarily important when thinking of the search terms as a network.
Again, it is tricky to turn these insights directly into something actionable, but we could calculate multiple centrality measurements (other common ones are the degree centrality and the closeness centrality) for each of the nodes, and include them somehow as variables in our machine learning models to rank the products displayed to the users. In fact, SNA is often used not to predict outcomes, but to create variables that help to predict outcomes.
The Complete Graph
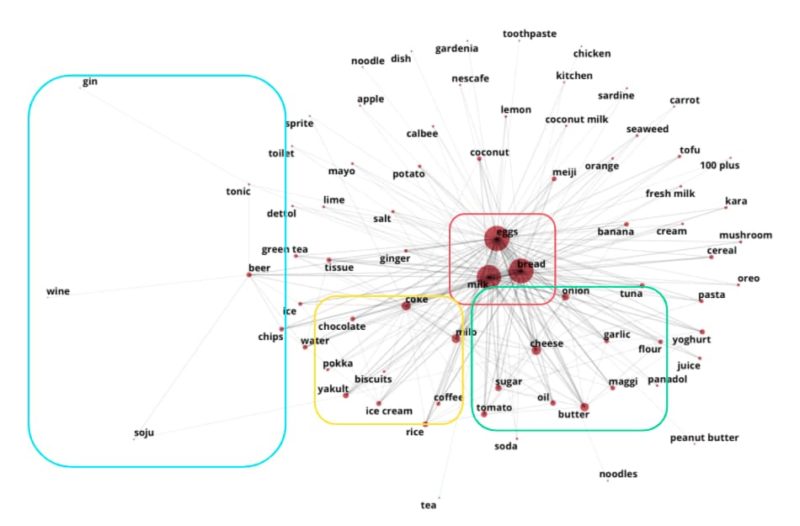
One of the things I like the most about SNA are the visuals. The graph below uses one month of data for one of the countries where Delivery Hero operates. From a visual point of view, it is quite easy to notice patterns that could be powerful. For example: people tend to buy gin, tonic, beer, wine and soju together, as well as onion, cheese, garlic, oil, butter and tomato. In this way, SNA could be a way to define categories, bundles and other promotions in a particular country. Also knowing how often people search and buy milk, bread and eggs together, could be a hint that we need a shortcut for people to search for these products and buy their favorite brands more easily.
What’s next?
In this article, I gave a very simple and short introduction of what Social Network Analysis is, and how we could use it on the Search Team at Delivery Hero, either to create variables for our ranking models, or to think of how to make the user’s search journey smoother. Of course, this is just a glimpse of the many concepts that exist in the field and its potential applications. I encourage you to step out of the cause and effect way of thinking for a minute and discover the SNA approach.
Feel free to reach out to me via Linkedin if you want to discuss Social Network Analysis topics and make sure you check our career site to find open Analytics job opportunities!
Thank you, Lina, for sharing these social network analysis insights with us!
As Lina mentioned, we are still hiring, so check out some of our latest openings, or join our Talent Community to stay up to date with what’s going on at Delivery Hero and receive customized job alerts!


