


Delivery Hero is a global food delivery leader present in over 70 markets across the globe. Our systems, from CPU usage to request throughput and error rates, show distinct seasonality patterns. In this post, we’ll examine international variations.
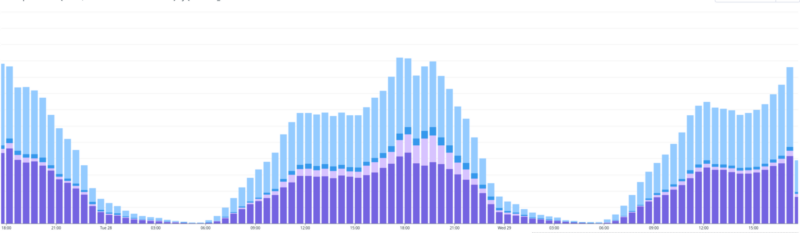
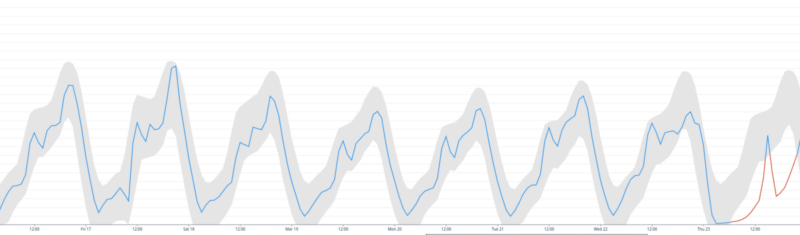
Nearly every member of the tech team at Delivery Hero is familiar with the “lunch bump” and “dinner peak.” In the food industry, these patterns recur consistently across all of our dashboards.
In this blog post, which is Part 1 of 3 in a series on Seasonality Regression, we will explore this pattern in greater detail. Particularly, how these strongly consistent patterns have subtle variations in a global environment.
Observability as Time Series Analysis
These patterns can generally be analyzed using the tools of time series analysis. In this context, a time series refers to a collection of data points (of any variable: CPU utilization, requests, temperature, stock price) ordered in time. This also applies to observability data in computer systems: orders placed over time, 4xx error rate over time, p95 latency over time, and so on.
When your data meets this definition you can usually make certain assumptions:
- Given two data points, if you subsample a third point in between them in time, you expect the value to be roughly in between their values. We generally prefer to ignore quantum fluctuations in our server metrics.
- If something about the system changes (e.g. you release an optimization of some code) you can expect the signal to change. Fortunately, such changes are usually easy to predict.
- If something about the context changes (e.g. more users interact with your system) you can expect the signal to change. Often, these context changes are predictable, but much less easily.
With some sophisticated mathematical tools, it is possible to forecast what the signal may be in the future. Luckily, there are many excellent observability tools available to most developers that already implement such forecasting features and they do a pretty decent job (when used well). While this post will not cover alerting based on these forecasts (which we will save for another instalment in this series), the following sections will show where such tools can do very well and where they can fall flat.
Seasonality in Food Delivery
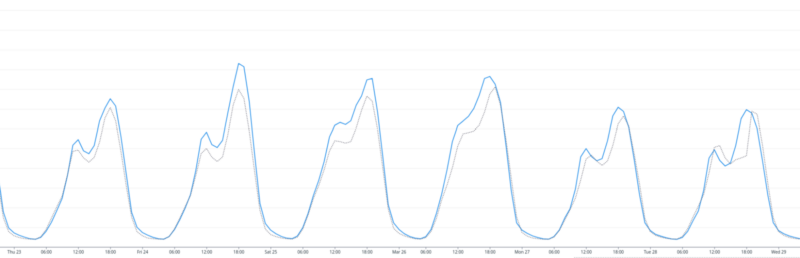
Time series data is considered seasonal when it displays recurring patterns. The term comes from a well-known example: the seasons give us all an impression of when to plan summer holidays, and when they repeat. We have already seen an example of daily seasonality, as Delivery Hero experiences similar patterns day-over-day with the lunch and dinner traffic bursts.
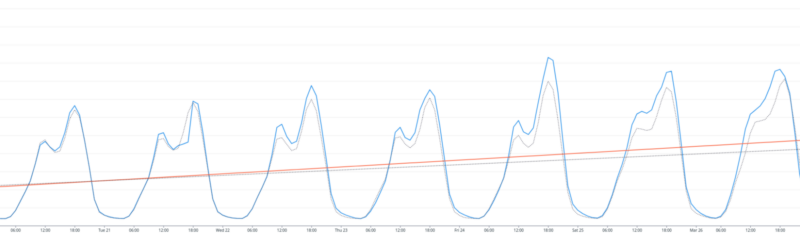
We observe multiple seasonality patterns in our data. For instance, request throughput (in many of our services) follows a weekly seasonality. Specifically, the throughput is usually lowest on Mondays and steadily increases throughout the week, peaking on Sunday, before resetting again for the following Monday.
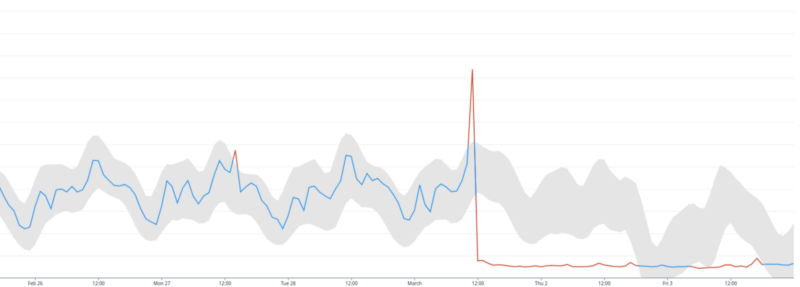
While we have identified several seasonal patterns in our data, some of them are relatively subtle and less exciting. What is often more intriguing is to examine when these seasonal patterns fall apart.
When Patterns Fall Apart
The straightforward answer to the question of when a seasonal pattern should no longer be used for forecasting is when there is a change in the system. For example, if you release a change to adopt asynchronous coroutines where previously your application was all-synchronous, you should expect a shift in the data pattern. While we often celebrate such pattern breaking as performance wins, in some cases, the opposite changes may be viewed as incidents.
Other, less obvious, reasons for these forecasts to lose their validity is a changing context. These can be sneakier, but two examples should be readily familiar to most readers: holidays and daylight savings time. Daylight savings time is quite straightforward to predict (unless you’re from Indiana), though not always included in a forecast. Holidays are also easy to predict, though since holidays cross-regional/national/ethnic/religious boundaries, they are very difficult to segment. Many forecasting features in observability tools, justifiably, avoid this complexity by not implementing holidays at all. One example of how we saw this was a false alarm, reminding us to wish our colleagues Ramadan Mubarak.
Conclusion
In this post, we explored time series in observability and observed how they take on seasonal patterns in a few different contexts. In the next post in this series, we will take a deeper look into a selection of forecasting algorithms available in several observability tools. The final post in this series will take a more practical approach, offering some specific examples of how and when to tweak these forecasting algorithms.
Would you like to become a Hero? We have good news for you, join our Talent Community to stay up to date with what’s going on at Delivery Hero and receive customised job alerts!


