I was introduced to the Driver Tree concept a few years ago at my previous employer. It was introduced by our leadership to support our growth and focus the teams on how they could contribute to the success of the business. It worked. After its adoption, there was a noticeable elevation in the effectiveness of teams across the business.
Driver Trees (also known as KPI Trees) are a simple effective tool that can be used in almost any organisation. In this article, I want to explore the concept in more detail, explain how they can help your organisation and give you some tips on using them.
What is a Driver Tree?
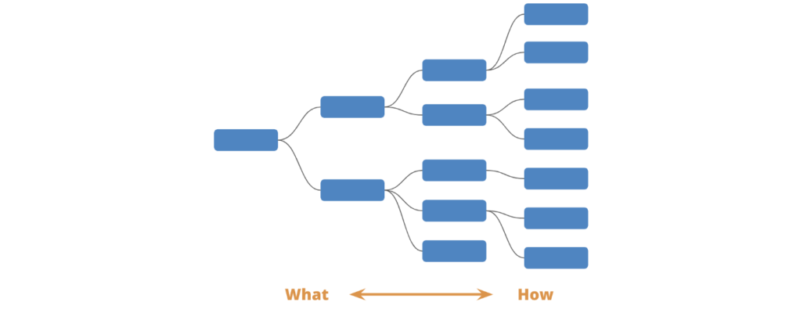
A Driver Tree is a map of how different metrics and levers in an organisation fit together. On the far left, you have an overarching metric you want to drive. This is the ultimate goal you want all the teams to be working towards.
As you move to the right, you become more granular in terms of how you want to achieve that goal. Each branch gives you an indicator of the component parts that make up the “what” above them.
Let’s apply this to a more tangible example of “being healthy”. Let’s assume I want to become healthier — this is a big goal and actually has many different avenues that can lead me there. Do I want to be more physically fit, more mentally healthy or improve my eating? These are all viable drivers of being more healthy.
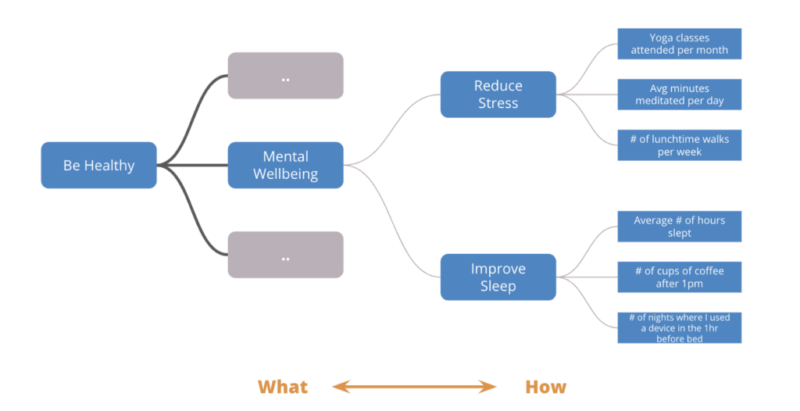
In the example above, I decided to explore “Mental Wellbeing” which is one of the drivers (to me) of being healthy. The aim is to continue to break each of these drivers into more specific and manageable drivers. Continuing down the tree the next two drivers are “Reduce Stress” and “Improve Sleep”. Getting to the bottom of the tree, you will notice that the examples are given are very specific. These can be tracked and actioned individually.
Now, this is the important point – just because I meditated for 10minutes every day I can’t say I’m healthy. However, the compounding effect of all the smaller actions rollup to the driver above. This is where the value of a driver tree comes from — it helps you understand the specifics that you can action. For example, if I want to improve how much I meditate I could add it to my routine, creating a separate space for this activity or downloading an app to guide me.
It’s this model and methodology we can apply to the component parts of our business.
The Value of Driver Trees
Driver Trees have 3 main value components for an organisation:
- Improve Understanding
- Foster Alignment
- Drive Focus
Improving Understanding
Driver Trees are a useful tool in helping breakdown the complex nature of your business. They allow you to abstract some of the complexity of your business to help everyone understand how the overarching pieces fit together (what is the model? how do we generate revenue? where do our costs go?). This benefits everyone in the organization, from the leadership, and across departments, and builds a map enabling different groups to discuss impact.
With that understanding, it is much easier for individual teams to understand how they factor into it the success of an organization. This is an essential part of shifting mindsets from outputs to outcomes. When teams recognize their work extends beyond closing tickets and understands their connection to the wider mission, you’re going to unlock the real impact of the autonomous team. A clear purpose that has meaning is what most organizations miss when they’re trying to get real and lasting buy-in from their employees.
Fostering Alignment
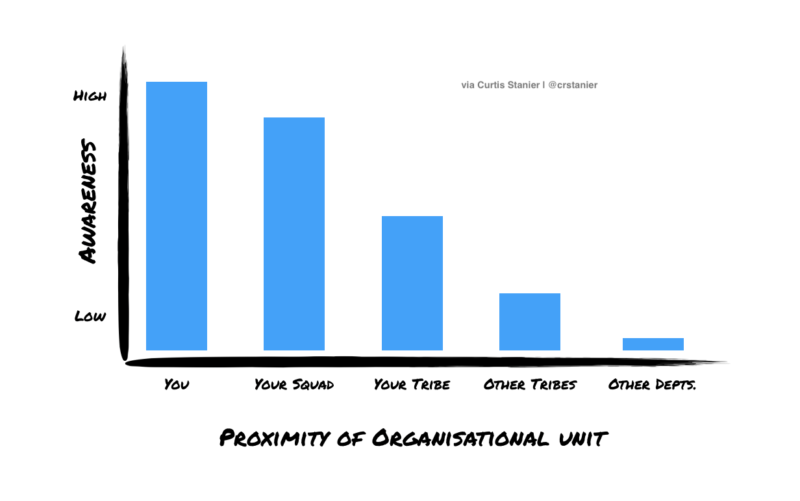
Humans are notoriously bad at communicating across larger groups — it’s one of the reasons that the Spotify Model promotes smaller teams. As organisations scale, they traditionally struggle with scaling communication channels and information silos form. It can be difficult to understand what another team is working on and, more importantly, why.
The Driver Tree acts as a common frame of reference for you and your colleagues during discussions. It can act as a trigger for understanding “why” when discussing requests and opportunities with your stakeholders. It helps help the organization understand which opportunities may be under-invested.
Driving Focus
The driver tree abstracts a lot of complexity, however, when combined with metrics, it helps unearth potential opportunity areas and acts as a guide.
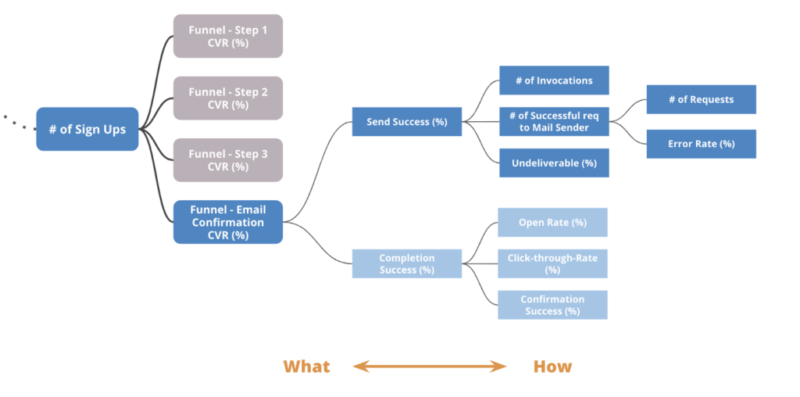
Let’s take an example. Imagine you’re the Product Manager for a funnel team and your aim is to increase the number of metrics. You see the % of customers that successfully complete the “Email Confirmation” step is only 50%. There are a few potential drivers in this— are the customers even receiving the email? If they are, why aren’t they clicking through? Again, each of these avenues may have further influencing factors.
By mapping the process flow onto the Driver Tree, you’re able to break down the topic. It could be that you find your 3rd Party Provider returns an error 10% of the time, meaning the email isn’t even sent — this becomes the opportunity area for your team. You’re now working through a specific problem that you and your team can tackle together.
A colleague of mine previously commented that there are similarities between Driver Trees and Terresa Torres’ Opportunity Solution tree. Although there are some commonalities, I see the Driver Trees as a more general overview with the Opportunity Solution being the better tool to direction on how to influence the Driver Tree.
Defining Your Driver Tree
Let’s take a look at how you could approach a driver tree. Imagine a situation where you’re the Product Manager for the Netflix Homepage:

Our role is to support the total number of conversions. We affect this by driving the overall conversion rate (CVR) and this, in turn, is affected by each step in the funnel. The higher the CVR of each of those steps the more of our customers will complete the funnel.
Start by adding anything you know that affects conversion rate. First, let’s add Page Load Speed. Google have shared extensively on the impact of Load Speed on Conversion. Using this as a starting point, we can explore what affects Page Load speed.
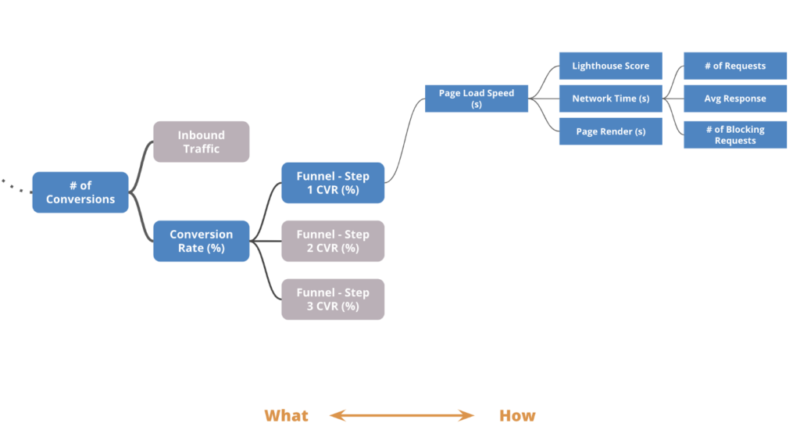
Two examples may be the time spend on Network Requests and another spend on the rendering. Again, following the “Network Time” branch, we can look at:
- # of Requests being made
- Average Response Time
- # of Blocking Requests (requests we need to wait for)
I also included Lighthouse Score (as one of the elements is Performance) to give us another metric as a reference point.
We can continue to extend this by looking are core metrics we’re getting out of tools like Google Analytics. Are people leaving our site (Site Drop-Off / Exit Rate) or are they exiting our funnel (e.g. Navigating to a ‘Help’ Page). Finally, we can even look for micro funnels on the page itself. In the Netflix example, I’d be interested in exploring how many people start entering their email, how many attempts to submit and what type of errors they’re getting back. These are all aspects that help you map out why “Funnel — Step 1 CVR %” is in it’s the current state.
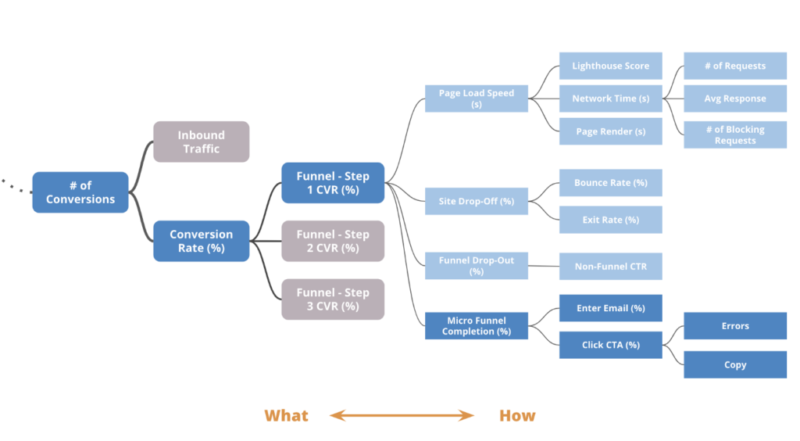
Note, the driver tree doesn’t tell you how to affect or driver lower level metrics. If the Exit Rate (%) is 10%, you still need to discover why this is the case — the tree will only help you understand what is true.
Tips for Driver Trees
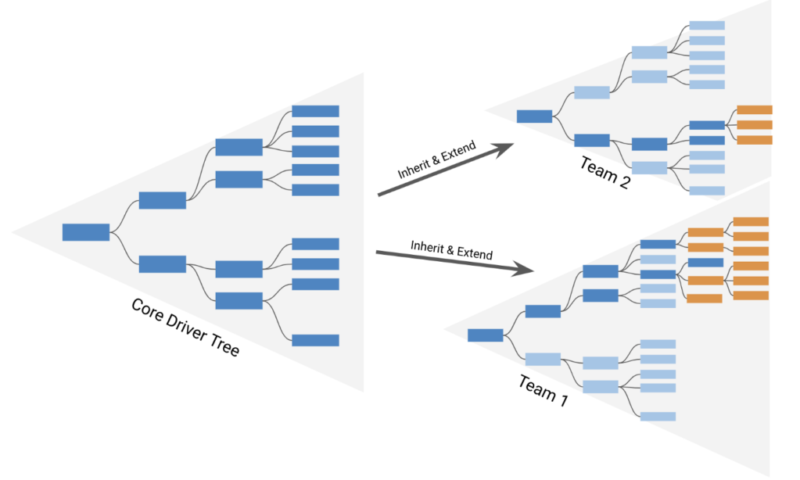
Empower the teams — The core of the tree can be developed by a smaller team with a good and broad understanding of how the business works. However, in larger organisations, it is unlikely that one group will have the knowledge to develop the entire tree alone. In that situation, trust in the individual teams to inherit and extend the tree with their specialist domain knowledge.
Involve everyone — There are a couple of dimensions to this. First, when you’re starting out, try to reach broadly across the organisation. When doing this process at Delivery Hero, we cut across the organisation. This is a time when it is useful to have Senior Leadership involvement because they can make connections and introductions that you may not be aware of.
The second dimension is continuing this theme in team- or squad-specific workshops. When there is a natural overlap of different teams, involve them together. This allows a sharing of ideas, perspectives and contexts which the driver tree aims to capture. Some of the most effective Driver Tree workshops we did were the ones that involved the squads and their key stakeholders.
Start with your goal — The top of the tree should be something that makes sense for all your organisation to work towards. If you’re a for-profit enterprise you can keep this as simple as “Gross Profit,” however, if you have a North Start Metric that you know is tightly coupled to your business and customer success, this would also work.
Don’t be dogmatic — During this process, you’ll find that some metrics and indicators could appear in multiple locations. Although you should aim to minimise overlap, I’ve never considered it a major issue. The Driver Tree is a way of abstracting complexity and does not have to be a perfect representation.
Use Metrics — Aim to use metrics as the individual drivers (blocks). This makes each element much more specific and helps you understand what impact you’re actually having. The tree will likely include a combination of business (revenue, cost), departmental (Email Open Rate, Ticket Response Time) and technical (% of API 500 Errors) metrics. However…
It’s not a dashboard — There will always be an incentive to translate this into a dashboard with red and green numbers. While I agree there is value in that, your initial step should be as an education tool — not a reporting one.
Validate — The first draft of your tree will include metrics you know are important and some you assume are important. As part of your Product Development, you will spend time validating (or invalidating them). You don’t have to get it right the first time. Remember, you will still…
Iterate — Both the core of the tree and any more granular ones you do will constantly evolve. As you learn more about your product, your business and your customers it is natural for it to evolve. Don’t be afraid of this change (embrace it).
Make it public —Do your best to make the Driver Tree public. Make it accessible in your knowledge management tool for anyone in the organisation, have the teams post physical copies of it in their work areas and reference it in their planning and alignment sessions.
Include in the onboarding — Organisations have a natural churn in the workforce, some people leave and others join. Be sure that your new joiners are introduced to the concept and how it applies to their role. This is a great way to give context to your new joiners in their early days and provides a skeleton for the rest of the knowledge they will gain during onboarding. We’ve been doing this at Delivery Hero with very positive feedback. Want to see for yourself? We’re hiring
Conclusion
Introducing Driver Trees takes time and effort, however, I’ve found it’s one of the most effective tools to create a more holistic understanding of how your business works. This is an important building block in creating effective Product Teams that can focus on value creation over just feature delivery. Further, they act as a communication artifact to help you build alignment across your stakeholders.


