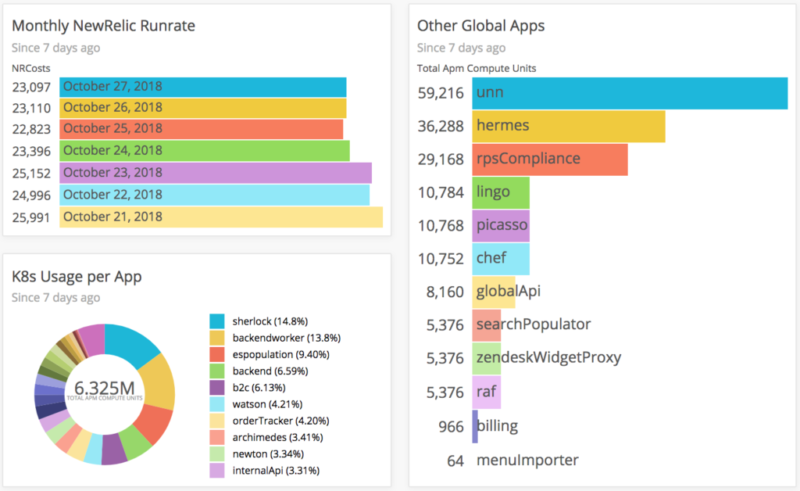
Having used NewRelic for more than 5 years, at Delivery Hero we only just recently started taking advantage of a few pretty awesome, but so far unknown/ignored features. Let me quickly go through them:
1) Insights
Most importantly: To use NewRelic to its full extent, you and every person around you should get comfortable with NRQL and use NewRelic Insight! Especially with 100s of NewRelic applications (due to many countries and services) only with insights can we drill deep and nicely visualize our data. We have 100s of dashboards created by engineers, QAs, product managers – shown on many screens all over the office.
2) Custom Attributes
Insights got even more powerful when we started to extensively report product and business specific KPIs to NewRelic. This is possible using the Custom Attributes, which are basically plain key-value pairs reported with each transaction.
They allowed us to know (and visualize, alert, co-relate) thinks like:
- the amount of restaurants requested per area
- orders per platform and country (much more real-time than Google Analytics)
- reason for unsuccessful logins
- payment charge-back rates per payment provider
- age of currently processed message
- usage of technical fallback (without triggering errors as before)
- etc
It’s as simple as:
if (extension_loaded('newrelic')) {
    newrelic_add_custom_parameter ('[key]', [value]);
}
3) Costs Analytics
One of the – so far – weakest points of NewRelic, the tracking NewRelic usage in Cloud environments like AWS, recently became a huge strength.
As I (and obviously also others) recently discovered, all charts in the NewRelic Account > Subscription section are based on an Insight Metric (=table) called NrDailyUsage. It’s basically a log of all applications NewRelic monitored, including their host name, instance type, length and extend of usage, resulting in an assigned amount of Compute Units. (documentation of all fields)
Leveraging this data allowed us for the first time to measure and optimize application specific resource usage within our Kubernetes clusters.
When we recently refactored an app to be able to handle multiple countries, we could more precise than ever before track the improvements in cluster utilization: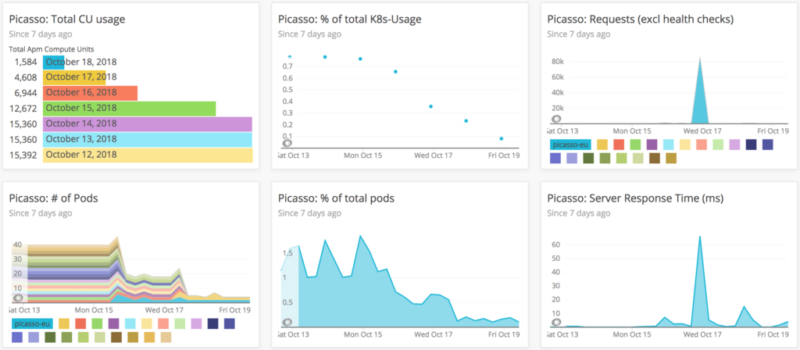
Here are some simple queries to get you started:
SELECT sum(apmComputeUnits) as CuPerApp FROM NrDailyUsage FACET apmAppName WHERE `productLine` = 'APM' and `usageType` = 'Application' and consumingAccountId = '12345' and cloudZone LIKE '%-%' LIMIT 40

SELECT SUM(apmComputeUnits) * 0.01033 * 30 as NewRelicCostsMonthlyRunrate FROM NrDailyUsage WHERE `productLine` = 'APM' AND `usageType` = 'Host' FACET dateOf(timestamp)

SELECT uniquecount(agentHostname) FROM NrDailyUsage LIMIT 40 WHERE `productLine` = 'APM' and `usageType` = 'Host' and consumingAccountId = '12345' and cloudZone LIKE '%-%' facet cloudInstanceType
4) NRQL Alerts
By now readers of this post are for sure already NRQL experts. That allows them to create very powerful, custom NRQL Alerts, far beyond the good old x% error rate for y minutes.
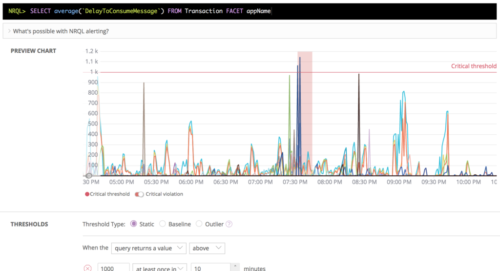
And by the way, the small Outlier radio button on the screenshot represents the start to machine learning based anomaly detection.
5) Alert + Insights
There is even a nice way to analyze NewRelic Alert events in insights: https://blog.newrelic.com/product-news/sending-alerts-data-to-insights/
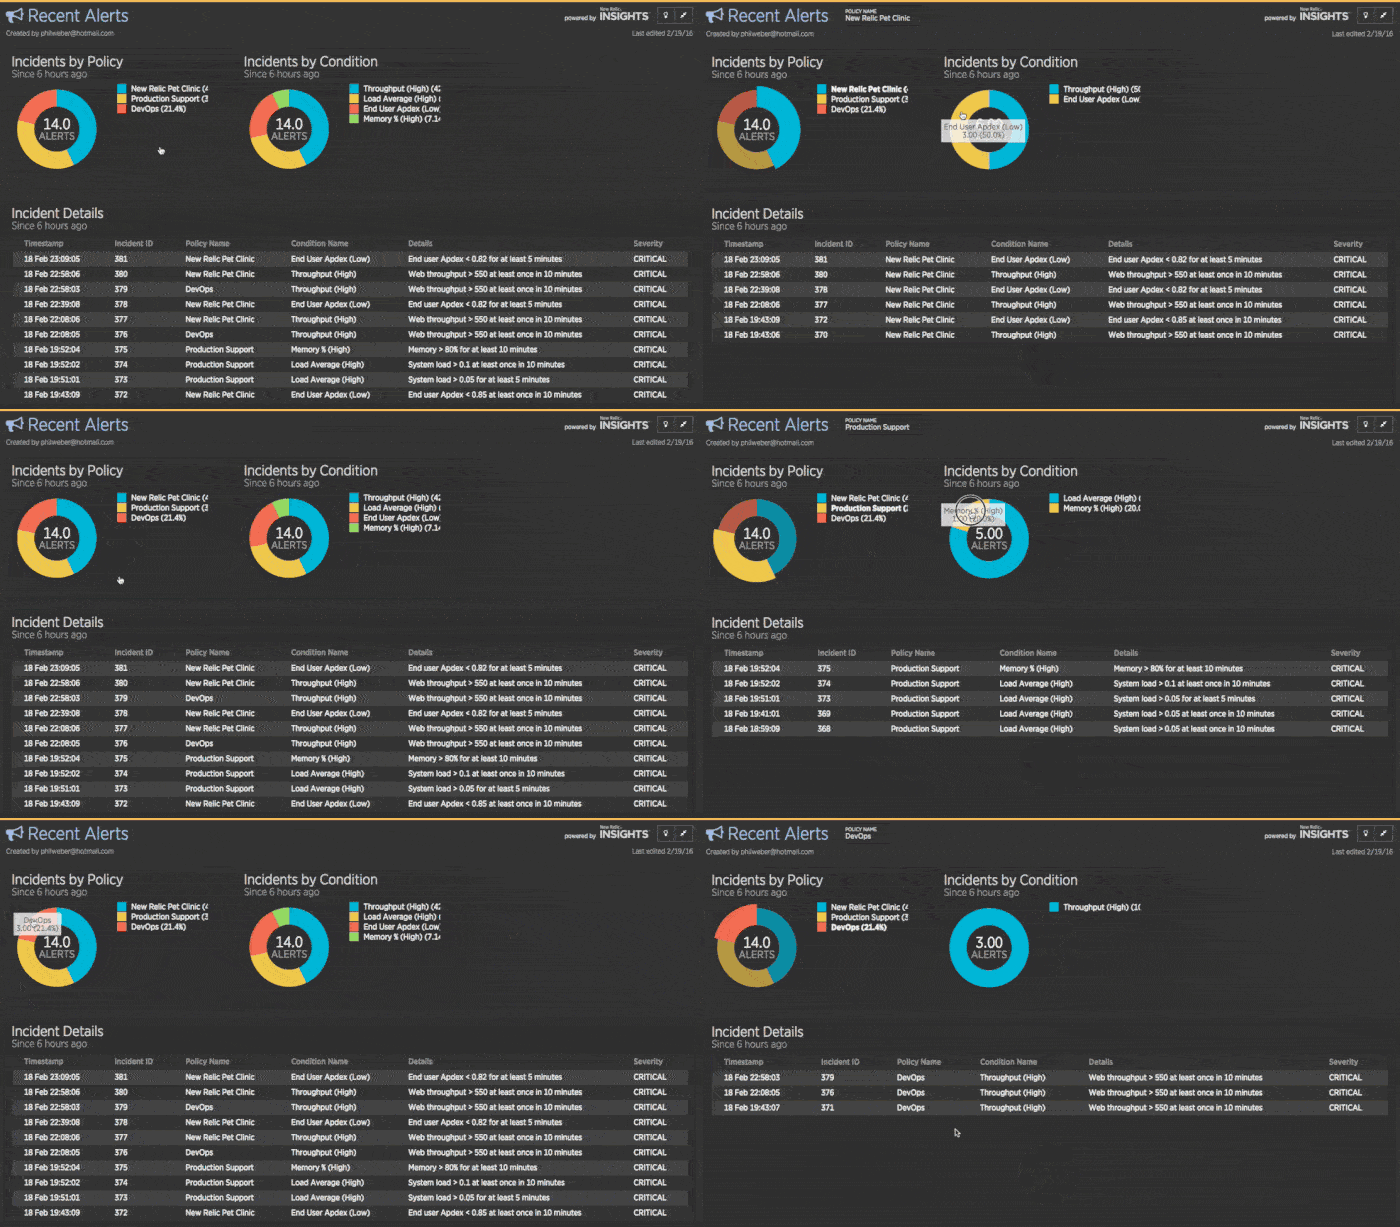
Seeing the historical occurrence of alerts helped us a lot to reduce alert noise.
6) Monitor PHP Workers
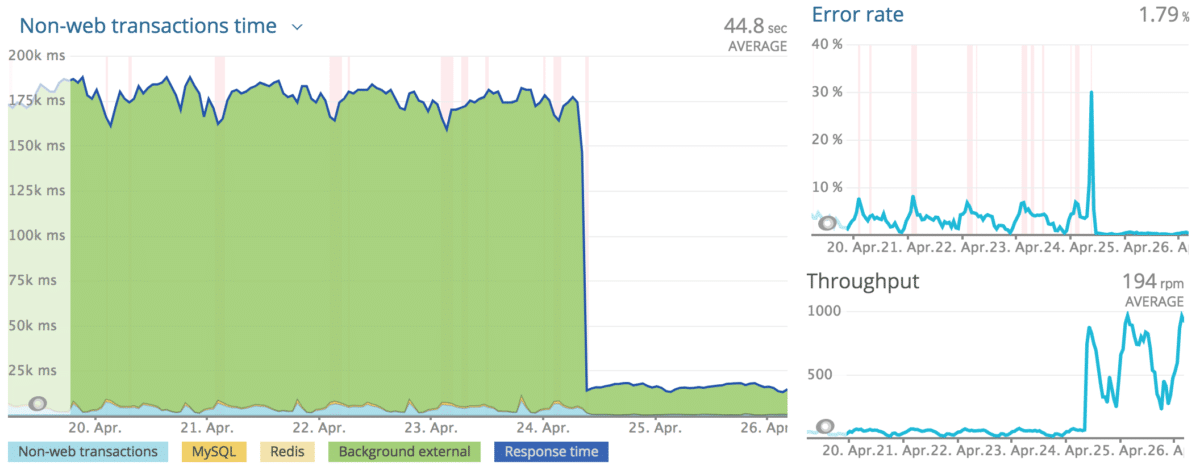
Long running PHP processes like cron jobs have been difficult to monitor for us. When many actions like consuming messages from the queue are tracked with the out-of-the-box NewRelic settings, individual metrics such as run-time and error rate are difficult to see. The solution: Manually starting and stopping transactions. See documentation: See documentation.
The most common use for this call is to improve instrumentation of command line scripts that handle job queue processing. Call this method at the end of a particular job, and then call newrelic_start_transaction() when a new task is pulled off the queue.
The following chart illustrates how much more visibility and thus chances for improvement this little change gave us:
7) App Labels
Of course every NewRelic user knows about app labels (see documentation) as a neat way to group apps in the application overview. We never bothered, but just recently realized how powerful these labels are for creation of alerts. Instead of selecting applications manually (out of our 800) when creating alerts, it’s much simpler, less error prone and more future-proof to always use labels.
8) Multiple App Names
In an environment like ours with many countries, environments and microservices, the ability to report transactions to multiple NewRelic apps at once (see documentation) was super helpful.
9) Rate function
Many KPIs make the most sense when measured in a fixed time frame like per minute or per hour (eg requests, orders, errors, signups), which was always hard to do.
Fortunately we found the super powerful NRQL rate function. MAGIC!
10) 404 – Not found
If you have another one, please let us know 🙂


