


Have you always wondered what the optimal conversion rate is when it comes to performance metrics? Read about how Konstantinos Giamalis, our Chief Product Officer at e-food (our entity in Greece), dives into why he is such a big fan of conversion rates as a metric.
Conversion rate as a must-have product metric
Conversion rate (aka CVR) is one of the most popular performance metrics, especially for digital platforms. Simply put, it’s the ratio of transactions to sessions, expressed as a percentage. For example, a ratio of 10 transactions out of 100 sessions would be expressed as a conversion rate of 10%. At first glance, its popularity is reasonable because it is one metric that includes both input and output data. That’s why is one of my favorite metrics. A platform with 300 transactions per month might be optimized or not but a platform with a 40% conversion rate is generally considered as a high-performance platform (yes, there are high-volume platforms that generate 25%+ conversion rates).

Moreover, most of the Marketing professionals use conversion rate in performance marketing reporting, so it makes perfect sense to expand its usage to platform performance as well.
Although it is widely used, conversion rate as a metric has some challenges and traps that you need to know before you create your first report for your boss, your investor, or for yourself. We use Google Analytics for our conversion rate reporting, so most of the learnings I’ll share are GA-related.
Also, even though I work in the marketplace industry, the challenges below are relevant for many industries that use conversion rates in their reporting foundation. In order to avoid exposing sensitive data, I will use datasets from Google Merchandise Store or other datasets without timelines.
TECHNICAL UNDERSTANDING
Although many Product Marketing professionals are savvy with the usage of conversion rate as an optimization metric, few of them truly understand how tracking works. Especially in big companies, tracking implementation and maintenance is the responsibility of the Tech or Analytics team, so many Product Managers are not even aware of the setup schema.
Session vs user conversion rate
One of the biggest misconceptions regarding conversion rate is that is measuring performance at user level. Actually, even user-level data are just cookies in a browser. So a user that uses two browsers has two cookies, so within Google Analytics it is considered as two different users. There are ways to tackle this, but they are too technical so they are irrelevant to this blog post.
Here is a brief explanation of how Google Analytics tracking works and here is an explanatory article for more details.

Conversion rate is calculated using “sessions” and not “users” from GA. In order to highlight the difference, we’ll use a dataset to calculate conversion rate using “users” and “sessions” data.

Applying the conversion rate formula using “users” data, (which is in the first row of the report which may confuse people that are not aware of the difference between “users” and “sessions”) 2,178/18,057×100 = 12% conversion rate
Now, we apply the formula with the right numbers using “sessions” instead of “users” data, just for validation purposes: 2,178/24,507×100 = 8,89% conversion rate.
This means that here we have more than 3% conversion rate discrepancy (in absolute numbers).
Quick example:
Imagine that 2 days before the calculation we made an improvement on our website speed by 1 second. Now we calculate our conversion rate using “users data” and we see a 3% increase. According to research that I found on the web a brand saw up to a 2% increase in conversions for every 1 second of improvement in load time.
Also, 100ms improvement resulted in up to 1% increase in revenue. So based on the research post, we can assume our speed optimization correlates 100% with the (false) increase, so we increased our performance by optimizing website speed!
Note: This is a farfetched example, using wrong correlations along with tracking issues and an overall misunderstanding of how we should do a data-driven evaluation. I hope that this is the first (and the last) time that you see something like this!
Setup discrepancies
Although practically, transactions and purchases are the same, you can see that there are two ways of measurement within GA demo account. The first one is eCommerce tracking (transactions) while the second one is Goal tracking (Purchase completed).
This is happening for a number of reasons. One of those reasons is the cross-validation of eCommerce tracking. This means that you can quickly check if eCommerce measurement is working correctly. Another reason is that if eCommerce tracking brakes, we will still have the goal tracking in place so we will not miss any transactions. But the main difference between transactions and goals is that within a session a goal can be triggered only once even if you complete this goal twice or more.
If you check the number of transactions and the number of goals for the same time period, you will notice that there is a discrepancy between those numbers. This discrepancy in the GA demo account example is 4.57%. If your platform has millions of transactions though, even a 4% discrepancy might lead to completely false numbers. Always check discrepancies between goal setup, eCommerce transactions and your database transactions to ensure that you have a healthy reporting pipeline.

Aggregated Data
This phenomenon doesn’t occur only with conversion rate but with many metrics, as well. As Avinash Kaushik says “All data in aggregate is crap”. Aggregated data may provide a quick overview but they may hide information that can lead to false insights. We’ll use the same example as above:

As you can see the overall e-commerce conversion rate is 3.67%. If you check the percentages of each channel you will realize that these numbers vary in deviation, from 0.03% to 8.89%. Also, their weight varies as well, from 44K sessions to 323 and 1 transaction to 2K. So, the aggregate number of 3.67% does not represent clearly the performance state of the platform. You need to apply the right segmentation to be relevant and create useful insights.
Tracking issues
Platforms that have high release tempo and do multiple code changes within a day have to embrace strict QA processes to avoid potential tracking issues. Here, I want to share a bizarre example that I faced in my previous job. I had to prepare a report for a client of ours, here you can see a daily performance report of conversion rate per hour. At first glance, it seems ok but then I checked some customer care reports and I noticed that we had 30 minutes downtime within the day.
Can you spot the downtime?

What about now?

The downtime happened from 14:05 until 14:35. But as you can see, the ratio between sessions and transactions that occurred from 14:00 to 14:05 and from14:35 to 15:00 was 12% which is a normal hourly conversion rate for this type of site. This is happening because when a website is down, Google Analytics is not measuring any sessions or transactions as well. Tracking issues can cause massive problems to your reporting so please be aware and always cross-check your data before you publish your report.
Marketing attribution issues
One of the most important technique in terms of budget allocation and performance is Marketing attribution understanding. I already wrote a post about attribution models but it seems that most of the professionals don’t believe that they should explore other attribution models, rather than last-click attribution. This method is so undervalued that it hasn’t even traction in Google search!

The default attribution model of Google Analytics is last-click which means that the last step of user experience within the last 30 days will get 100% of conversion value. So, if your user visit your homepage 10 times, only the last visit before the order will get a conversion value of 1 while all other visits will get 0.
Let’s visualize it:

Zero value for Facebook ads and zero value for other landing pages except product page
Now let’s check the model that Google uses as a default in non multi-channel funnels reports, which means the reports that you see in your dashboards. As Google inform us ” The Last Non-Direct Click model ignores direct traffic and attributes 100% of the conversion value to the last channel that the customer clicked through from before buying or converting. Analytics uses this model by default when attributing conversion value in non-Multi-Channel Funnels reports. “
Let’s visualize it again:
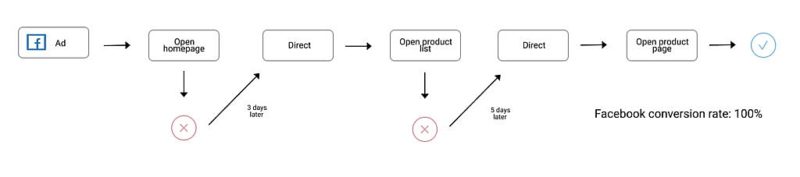
Here we see that even when the last visit was direct, the conversion value went entirely to Facebook because it was the last non-direct one. Different methodology leads to different report, which leads to different results, which lead to different insights, which lead to different decisions. Some of the challenges above may see minor, but in hyper-growth platforms with multi-million conversions these minor changes can lead to completely irrelevant results.
BUSINESS UNDERSTANDING
Besides technical understanding, a Product Manager should have strong business acumen to understand the context behind the numbers. Without context, you can’t produce insights, because the numbers can tell you what happened but they can’t tell you why it happened.
Someone asked me “Do you need business or product acumen?”. In most of the cases I have faced so far, the business understanding was the key to unlock most of the valuable insights, simply because our business depends entirely on our product, so in our case product performance means business performance. In many industries and businesses, product acumen means business acumen.
“In many industries, product understanding means business understanding.“
It is dangerous to use conversion rate as a stand-alone metric
Even if your analysis includes segmented conversion rate based on devices, conversion rate per channel, month over month and year over year comparison, and all other relevant segmentations and drill-downs, having only conversion rate metrics in an analysis can be very tricky and misleading.
Here is an interesting example:

In this comparison, we compare equal time ranges and we see that although the conversion rate increased by 16.59% (note here, that GA presents relative and not absolute numbers), the actual conversions skyrocketed by 77.44%. If we didn’t check the orders, we would miss that important information. Also, with this example, we understand that conversion rate and orders have no linear correlation.
If only we could assume that if we increase our sessions by 10x we will get 10x more orders!
Then the company with the biggest budget would win the competition which although sometimes is happening, it’s not a given.
Let’s check another example:

Here we see the performance of each channel. Let’s compare row #3 to row #4. Channel in row #3 [Paid Search] has almost equal conversion rate with the channel in row #4 [Organic Search], their difference is only 0.7%. Now, if we check their transactions though, we see that the channel in row #3 has 30x fewer transactions although it has a bigger conversion rate.
The difference is huge.
The reason why channels have different performance and they always will is that every channel behavior is different. The user purchase intention, the targeting capabilities and the potential of each channel vary and we need to spend a significant amount of money and time in order to understand how each channel can contribute more to our channel mix and how we can effectively spend our budget.
Conversion rate is a cross-department metric
Every time conversion rate drops, you need to understand why that happened and design the right solution. Although this is a straightforward process, there is a big number of drop-off reasons that are not related to the Product. In the digital industry, every department affects platform performance. Although I describe Sales, Operations and Marketing issues even Finance (high prices) and Legal department (grey policies) can influence conversion rate indirectly.
Sales & Operations
This is a brief overview that describes the conversion path of an online food delivery platform. The green arrows mean that the user is moving towards the order, while the red arrows are reasons for the user to abandon our service. Drop-off reasons from a marketplace platform could be a separate blog post on its own but here are some of the most common ones that are related to Sales and Operation teams.

Marketing
Besides Sales and Operation team issues, here I want to talk about the Marketing impact on conversion rate. I will enrich the flow above with the incoming sources, describing some of the channels that customers use in order to visit our platform. There are some channels that are not Marketing related (Direct traffic), others that are joined efforts between Product and Marketing (Organic traffic) but most of the other sources are handled by Marketing teams. So a large amount of sessions, one of the two metrics that help us calculate conversion rate, is handled by the Marketing team.

If the Marketing team fails to optimize channel performance, it will directly affect the conversion rate of the platform.
If the Marketing team allocates more budget to high-performance channels, the conversion rate will go up, even if we don’t make a single change within our product.
If the Marketing team forgets to add UTM tracking in campaigns that can’t be identified automatically (example: an advertising blog post in a high-volume news website), the direct traffic conversion rate will go down.

I added this pie chart to make my point clearer. This is an overview of top channels that drive traffic to Google Merchandise Store. Sessions from social media (besides dark social), paid search, affiliates and display which are considered pure Marketing channels are responsible for 24% of total traffic. Almost, one out of four sessions.
This is big.
To continue on this, take a look at the performance of each channel, for simplicity reasons I will include only channels aggregated data. In our example, although Marketing channels are responsible for 24% of total traffic, they contribute only 3% of total transactions.

External factors
Besides what is happening within our company, there are industry leverages that have a positive or negative impact on conversion rate. Some of them are:
Seasonality
Most of the industries have good periods and bad periods. These periods can be weeks, days or even hours. They can also be weather-related (raining, snowing, etc.) or other special occasions that have a high correlation with your industry and the solutions that you provide.
At the peak of a good period, many users with strong purchase intention are flocking to your platform. If they find what they want, conversion rate will skyrocket, if they don’t, conversion rate will sink. A nice example of seasonality for e-commerce is Black Friday. Personally speaking, my most challenging seasonality period is Easter. As you can understand, it’s very challenging because it’s not fixed (it changes every year) and its effect spans throughout many days before and after Easter day.
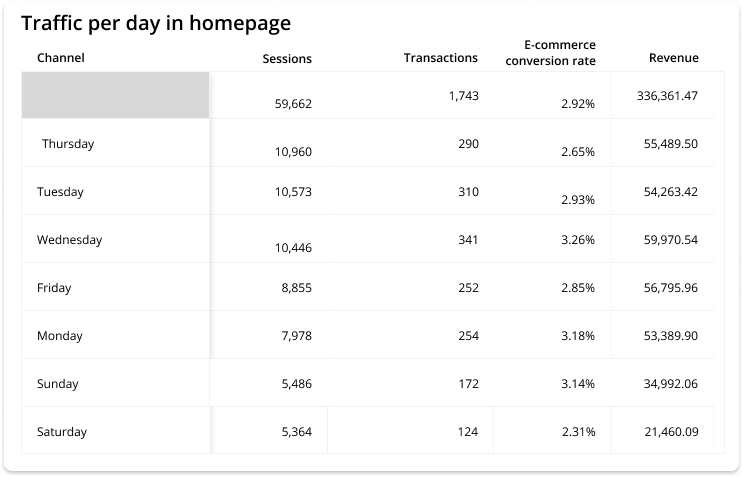
Let’s see an example with data now: We use transactions and e-commerce conversion rate at day level in order to produce the graph below:

Since the data are at day-level (you can see it on the top right of the image) we can easily identify that there are specific days in each week that transactions are relatively low.
Competition
Competition efforts are affecting your business overall, therefore they impact your conversion rate as well. By the time your competitors push aggressively with discounts, vouchers, and promotions most probably you will suffer a negative impact that can be either short-term (your users will try the other service but they will return to you) or long-term (your users will try the other service and stick with it).
SO, WHAT IS A GOOD CONVERSION RATE?
Let’s start this chapter with practical advice that relies on a philosophical concept.
Now, we assume that a 20% conversion rate is considered a great one.
What about 19.99%? This is great as well.
Now, what about 19.98%? This sounds great too.
With this technique, there is no single percentage that will distinguish a great conversion rate from a normal or a bad one. This concept called “Sorites Paradox” which concludes that there are no clear boundaries between fixed terms. That’s the main reason that we prefer terms like “better” or “worse” rather than “good” or “bad”.
The right conversion rate
As I said above, if your answer to the question “what is your conversion rate?” is a single number then you are missing the point of this metric. You need to have the right segmentation framework in place to better understand your product performance and identify potential challenges or opportunities. Segmentation though is not a binary concept. It has a spectrum.

As with every spectrum, you should avoid the edges. Single conversion rate is not helpful but a report that includes conversion rates for 30 dimensions is a disaster. Also, you should be savvy enough in order to navigate along the spectrum. If a C-level executive asks about conversion rates you should present a concise and representative report but if you want to optimize your platform’s performance you should check every dimension that matters.
The ability to navigate through levels and provide the right reports to the right people in my humble opinion is one of the skills that separate senior from junior product managers.

There is a principle in Analytics called “Occam’s razor” (any Avinash fans here?). This problem-solving principle states that it’s good to explain a phenomenon by the simplest hypothesis possible. It may sound cliche, but it’s very challenging to keep it simple because simplicity is not always objective.
Occam’s razor principle and countless hours spent in analysis led us to create the foundational set of metrics and dimensions of our conversion rate reporting. These dimensions & metrics are one of the best to start your conversion rate report. I personally use this set in other industries and business performance audits as well. It’s definitely not the holy grail but you can try it and let me know if you find it useful.

This set of dimensions & metrics is suitable for the Product and Marketing overview. I will briefly describe why we use those dimensions and metrics. Regarding metrics, transactions are the ideal end result for every session, there is no need for clarification. Acquisition stands for every first order of a new user. Acquisitions orders are one of the most important metrics for business growth. The platform that acquires new users affordably and can retain the biggest percentage of them (again, affordably) wins the game. Obviously, acquisitions are less than transactions so their segmentation should not be so deep as transactions.
Device performance most of the time differs. We separate devices into big buckets of website, a mobile website (+ tablets), Android & iOS. The performance of each device varies for a number of reasons:
- Android & iOS require installation before use, so App Store is part of the conversion flow,
- Website targets people that sit on their PC’s/laptops, while mobile website targets users that use their mobile phones (and do not prefer our apps).
Landing page grouping stands for groups of landing pages. We group our landing pages (we have a lot) according to their type. Every group of landing pages has different behavior. Here are some examples:
- Group of specific cuisine restaurants (ex. pizza)
- Group of restaurants in a specific city (ex. Larissa) ????
- Group of restaurants that are part of a big brand (ex. McDonald’s)
Lastly, Channel grouping is the way we group our Marketing channels. The performance of each channel varies greatly. I have already presented a relevant example above, please check the “conversion rate as stand-alone metric” section. The main difference between channels is that there are channels that have high purchase intention and there are channels whose traffic is considered as “branded performance” with a relatively high conversion rate.
You can use these dimensions in combination or as stand-alone. That means that you can check the conversion rate of each marketing channel or you can check the conversion rate of users that land on your mobile website’s homepage via direct source. We start from device categories performance and dig deeper as long as there is significant traction & performance. There is no reason to check a conversion flow that lands the 0,001% of your users.
Now, to put this framework in practice, I guess that the conversion rate of sessions in your iOS application that land on your homepage via direct source is significantly bigger than the conversion rate of your mobile web that lands in one of your blog posts via a Facebook ad. Am I right? ????
Conversion rate’s best friend
As Product Managers, when we overview our performance we use conversion rate along with transactions and/or revenue as the first step.
Here is a representative set of example cases:

Very healthy platform performance. Although it has a steady conversion rate, sessions & orders increase linearly. With the right marketing spend and product optimization, it can scale significantly. We can find that kind of performance in platforms with high retention or an early-stage business with Product-Market Fit.
Let’s check a revenue example. Here is the daily report we saw above in the “Seasonality” factor. In terms of transactions Thursday, Tuesday and Wednesday are the best days, while Sunday and Saturday are the worst. But in terms of conversion rates Monday, Sunday, and Wednesday are the best days. Wednesday and Sunday have a 0,12% conversion rate difference but Wednesday has almost double revenue (!).
What about benchmarks?
Benchmarking is one of the most popular ways to understand if your conversion rate is good or bad. According to an updated e-commerce research for 2020, the global benchmarks are between 1% and 4%. I’ve seen many stats regarding performance but most of the time I can’t find the initial source of analysis in order to check their methodology, sampling, time ranges, data quality, statistical errors, etc. Even the analysis that I used above, has different sources for different graphs.
Long story short, except for some (most of the time paid) analyses on the web, I don’t trust the majority of the analysis and stats that are available on the web. Here is an excellent article from CXL about marketing stats.
???? Since we are talking about benchmarking though, a good feature that Google could add in Analytics is the benchmark of e-commerce conversion rate. Or maybe someone else could create a service that would allow users to add their analytics data (anonymously) and get benchmark data according to their sector and industry. ????
“There is no good or bad conversion rate, there is only better or worse conversion rate.“
– Anonymous CRO specialist
To sum up, regardless of all those challenges that I described above, I am a big fan of conversion rate as a metric because not only does it help us understand what is happening within our product, but also it helps us understand the big picture and gain useful business understanding that will help us find the best product solution, not according to product best practices but according to real business needs.


