


Performance is crucial for tech companies as it directly affects users. This article offers an in-depth exploration of the underlying mechanisms and the step-by-step process of integrating baseline profiles, potentially boosting overall performance by 30%.
The performance of apps is crucial nowadays because it directly impacts users’ experiences. Notably, 25% of users abandon apps after the first use, with performance issues being a significant contributing factor. According to metrics, a 1% decrease in app startup time correlates to a 0.27% increase in user visitation (as observed by Facebook). Furthermore, 60% of consumers abandon a mobile app after just one use if they encounter performance-related problems. This highlights the importance of optimising app performance to avoid losing valuable opportunities and retain their user base.
An Intro to Baseline Profiles
The Android Runtime (ART) is the managed runtime used by our Android applications. One of its duties is to identify critical sections of code that are frequently executed. When our applications run for the first time, the runtime initially operates in interpreted mode until the JIT compiler runs. The JIT compiler then compiles frequently used parts of the code on the fly and extracts some baseline profiles from these runs. On the other hand, AOT compilation uses these profiles to compile only the frequently used parts of the code into .odex files, as declared inside the profile files of the libraries and applications.
This approach means AOT does not need to pre-compile the entire app (as was the case in Android 5.0), which decreases disk space usage, reduces installation time, and prevents the system from needing to re-optimize (re-compile) apps each time the OS is updated.

Different Types of Baseline Profiles
In the Android ecosystem, various types of baseline profiles exist. Here’s an expanded look at each type:
- Baseline Profiles: These profiles capture code paths accessed during user-critical flows within the app. Examples include the Home Screen, orders screen, and the order details on the profile screen.
- Startup Baseline Profiles: These profiles focus on app startup. Startup profiles help during the app’s compile time by moving the post-startup resources out of the main classes.dex file. This is known as one approach for DEX-level optimization.
- Cloud Profiles: Cloud Profiles use real-world baseline profiles to optimize app performance, but they take time to distribute and are only available for Android 9 or higher for apps published on the Google Play Store.
In this article, we will focus more on the first two types of profiles.
How to generate Baseline Profiles?
You have various options to generate the baseline profile depending on your project structure. However, I recommend utilizing Google’s Macrobenchmark library with the baseline profile module template.
Creating Baseline Profiles Using Module Templates
It’s Accessible via the File -> New Module menu. This module streamlines the process by incorporating all necessary configurations and Gradle tasks for generating baselines and benchmarking builds with baseline profiles.
Adding Tests for Baseline Profile Generation
Once you’ve created your module, you can easily generate both baseline and startup profiles with just two classes.

For the startup profile in the profileBlock, you only need to test the startup by opening the app’s most common entry points (launcher, deep links). There’s no need to add more tests there. For user flows baseline profiles, add tests for the most crucial user flows. For example, for us, it was login, orders, order details, profile, and other important areas. However, for your app, it will be different.
Running the Tests and Analyzing Results
You must execute these tests on a rooted Android device or an emulator with Android SDK 31+. Alternatively, you can easily run them on Gradle-managed devices, without needing an emulator. The Gradle task of the baseline profile module will automatically copy the output files into your selected build variant.
Startup Profiles: Under The Hood
Startup profiles work by placing the code that is frequently used during startup into the primary DEX file based on the startup-prof.txt. This involves moving post-startup code to different DEX files. This optimization reduces the startup time of your application, especially on lower-end devices, since the first DEX file contains only the necessary data for startup.

Understanding User Flows Baseline Profiles
To understand user flows baseline profiles, we need to revisit the roles of the JIT and AOT compilers. The JIT compiler translates JVM bytecodes to machine code at runtime, while the AOT compiler pre-compiles the code before execution. Starting from Android 7, ART uses both JIT and AOT compilations. Now, imagine we instruct ART to pre-compile specific classes and methods based on our user flow baseline profile(baseline-prof.txt) using a tool which is called dex2oat. By doing this, we bypass the interpretation and JIT modes in ART, directly using odex files, which boosts performance. The diagram below shows this process.

Decoding Profile Files: Understanding their Contents
The syntax for these rules extends the human-readable ART profile format (HRF). Each line represents a rule with specific formatting of the profile data, making it easier for engineers to understand and interpret.
[FLAGS][CLASS_DESCRIPTOR]->[METHOD_SIGNATURE]
- FLAGS: Use a combination of letters, H, S, and P, to show if this method needs to be marked as Hot, Startup, or Post Startup regarding the startup type.
- CLASS_DESCRIPTOR: Code Path of the targeted class.
- METHOD_SIGNATURE: The method signature.
Here’s a rule indicating a post-startup classpath.
[P][Landroidx/concurrent/futures/AbstractResolvableFuture$Waiter]:->[<clinit>()v]
Baseline Profiles for Libraries
Baseline profiles aren’t just for applications; they can also be generated for SDK libraries like Jetpack Compose or any in-house library that you developed inside your company using the Macrobenchmark tool. One example of baseline profiles for libraries is compose, for compose, having baseline profiles is essential because it is a library that isn’t precompiled on the device. Without baseline profiles, the JIT compiler would need to repeatedly compile hotspots and frequently used code. The Google team working on Compose addressed this by using baseline profiles, resulting in over 30% performance improvement for Compose overall.
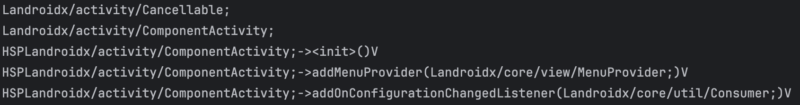
Here you can see the compose material3 baseline profiles provided by Google.
Ensuring Baseline Profile Installation on Your Device
We can use the Profile Installer library to install baseline profiles on apps not published on the Google Play Store. You can check the status with the code below, which gives you the baseline profile status of the app.

Automate the profile generation process(Optional)
When developing software at scale, automating this process is crucial. However, since teams often use different automation tools, let’s focus just on the steps involved. Baseline profiles are typically necessary for release builds to ensure optimal performance for end-users. While generating these profiles per release is a logical approach, you can generate them for any build variant. Below is a diagram which shows the approach for generating baseline profiles. While we recommend storing baseline profiles in your VCS, you also have the option to generate them per build and ignore them from your VCS.

Measuring the Impact: Methods for Evaluation
You can check the performance of both baseline profiles at different stages with various tools. For startup profiles, you can check the improvements in the dex level by releasing an APK and examining changes, especially in the first DEX file. Our finding was 30% of improvements regarding the initial dex file, For consistent measurement, you can set up a pipeline that runs with each new release, providing reports on startup profile enhancements.
To evaluate the cold startup of the app, you can test it locally using the Macrobenchmark library provided by Jetpack.

To see improvements from baseline-prof.txt, you can use the benchmark profile with various metrics such as startup time, frame timing, and other custom metrics. Additionally, you can observe the JIT thread in profiling tool traces, showing significantly less work compared to previous versions without baseline profiles.


Additionally, you can observe improvements from real users by utilizing Firebase Performance, Sentry Performance, or other third-party tools. According to data from Google, they observed more than a 30% improvement in performance for their different apps. For example, Google Play Store search results noticed a 40% reduction in rendering time. Also based on our findings, you should expect a 30% enhancement in overall app performance after integrating baseline profiles, with no additional effort required.
Conclusion
Performance is crucial for tech companies today as it directly impacts user satisfaction. Using baseline profiles can lead to a 30% improvement compared to your app’s previous versions without requiring extra effort. This approach is used not only by us but also by other tech companies like Google, Lyft, TikTok, and many others, all of which have confirmed notable improvements in their metrics.
If you like what you’ve read and you’re someone who wants to work on open, interesting projects in a caring environment, check out our full list of open roles here – from Backend to Frontend and everything in between. We’d love to have you on board for an amazing journey ahead.


